
The Ultimate Guide to Using Your Flaunter Data (To Make Yourself Indispensable)

If you’re like 99% of our customers, reporting is a big part of your job. But, it’s also probably the part of your job that generates the most headaches, whether it’s from an inability to access data, not being sure what to do with the data you’ve got, or clients pushing you for insights you don’t know how to find.
Enter, Flaunter.
Not only do we want to save you hours every week and minimise the time you spend in soul-sucking excel spreadsheets, we also want to help you give your clients the best possible data - making you an indispensable part of their team.
We all know that data on it’s own doesn’t mean much unless you’re able to interpret it, so read on for how to make use of the stats you’re able to pull from Flaunter.
TL:DR - Key Data You Need to Know About
Yes, this is a long post (there's just that much data you can get from your Flaunter account). So if you take nothing else from this post, here's some of the best data you can pull that will change the way you report forever:
Brands / Reports - See the date the journalist is expecting to publish your content. This makes media monitoring infinitely easier, and allows you to report to clients on your expected pipeline of media activity.
Sample Tracking / All Activity - See what samples are out or overdue in seconds when filtering by sample status, meaning you’ll never lose track of a sample again.
Press Centre / Reports / Download CSV - Get access to the emails of who downloaded your content which you can then put into your own media list for future outreach as well as turn into a VIP list for future releases.
Your Dashboard
If you’re after a super quick overview of what’s happening in your account, your dashboard is the first place to look:

Your dashboard will give you, at a glance:
How many images you’ve uploaded to Flaunter. This includes images you’ve uploaded to both your press centre and sample tracking.
How many times your images have been downloaded by editors and media, influencers and stockists.
How many times your content has been viewed by editors and media, influencers and stockists.
What does this tell me?
What your ‘conversion rate’ is like - if you’re getting a lot of views but not a lot of downloads, perhaps your image descriptions aren’t matching your products or your images don’t accurately convey the uniqueness of your brand.
A week-on-week comparison of how your downloads have increased, which you can report back to your clients or managers to indicate the traction you’re having with media, even if imagery hasn’t yet been published.
An indication of your press pipeline - if your downloads are increasing, it’s likely that your press coverage will also increase, which is always great news for clients.
You can track the relationship between the number of images and downloads. Most of our customers find that the more images they upload, the more their views and downloads will increase. Users that manage the majority of their images through Flaunter see increased efficiencies that ultimately lead to more coverage than those who use the tool more casually.

If you’re also using sample tracking, your dashboard will give you an overview of your sample tracking stats:
Average time of sample loan - how long a sample takes to be sent out and returned
Total samples available - the number of samples that are being managed through Flaunter
Samples currently out on loan
What does this tell me?
Tracking your average sample times means you can implement activities aimed at reducing the time samples spend out with media. The more efficient you are at getting samples out, shot, and returned, you’ll be able to then get those samples back out to editors and influencers faster, ultimately resulting in more coverage and more satisfied clients.
Understanding how many samples you currently have out on loan means you’re better able to track where your samples are at all times - meaning you’re less likely to lose track of product, saving clients money and you a whole heap of time explaining where that expensive product went missing.
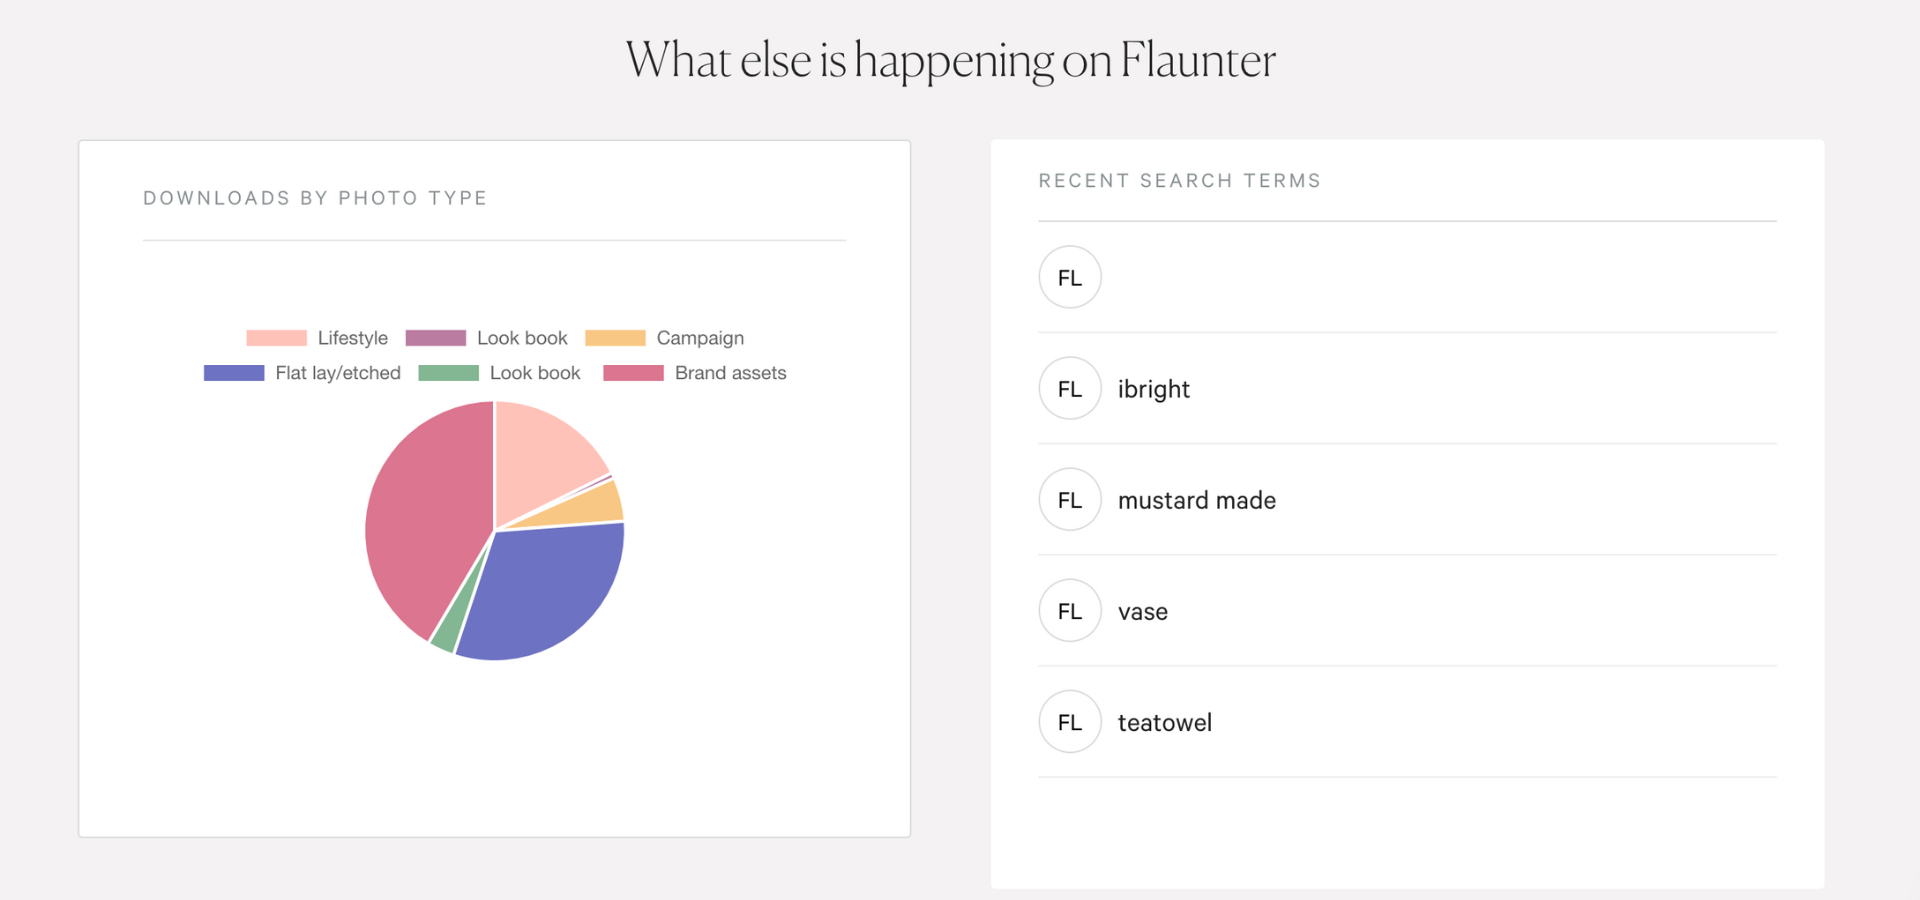
You’ll also be able to see key trends on the Flaunter platform, giving you a unique insight into how editors, influencers and stockists might be using your content:
Downloaded by photo type highlights what style of content is getting the most love from those accessing your content.
Recent search terms lets you see what people are searching to find your content.
What does this tell me?
What types of content downloaders are loving from your brand, and how you can create more of it - or how you can improve your less-downloaded content to make it more appealing to your audience.
Recent search terms can give you insight into how to optimise your product tags and descriptions to take advantage of searches you’re already showing up in, or how to better tag your content so that you show up in more searches.
Now that you’ve got the overview, let’s dive a little deeper.
Sample Tracking
Summary Report
Your sample list shows all of your samples and the frequency they are requested and borrowed at. You can sort the samples in your list by most and least borrowed, newest and oldest, and A-Z by product name.
You can filter samples by brand and rack to see at a glance how samples from different collections are performing.

What does this tell me?
Which samples are hot and which samples are not. By understanding which samples are in high demand and which ones are languishing on the showroom shelf, you’re able to provide your brands with unique insight into how media are responding to their collections, which can then be used by the brand to help with planning future collections.
Instead of those awkward conversations with clients about why a product isn’t getting coverage, you can show them the real data behind what’s working and what’s not.
All Activity
Your ‘All Activity’ hub is a powerhouse of information:
Sort your list of samples by newest, oldest, rack A-Z and borrower A-Z.
Add filters to drill down into your data by:
Brand
Racks
Date Range
Publication
Sample Status

What does that tell me?
If you’re managing multiple brands or you have multiple racks within a brand, you can separate your stats by brand. Compare performance of brands against each other to get insights into overall market and media activity - are you seeing growth across the board or is one particular brand taking off?
Segmenting your borrow requests by date makes monthly reporting simple - just download your data via CSV to integrate it into your existing reporting templates, or download a PDF that’s pretty enough to pass straight on to the client.
Filter samples by publication helps you see exactly what product Vogue have already borrowed, which means your next pitch can be even more targeted. Share links to similar products you know they’ll love, or pitch something you know they haven’t been able to touch and feel yet, to really win them over.
Work out what samples are out or overdue in seconds when filtering by sample status. No more trawling through spreadsheets to find out where your samples are (only to inevitably find that someone hasn’t logged their location properly), this simple report can be downloaded and given to interns to follow up, meaning you’ll never lose track of a sample again.
Downloading your data via CSV gives you access to a goldmine - this spreadsheet not only shows you the status of all of your samples, but also highlights the editor who borrowed the product, their email address, and (if you’ve added the data in when sending samples) gives you a list of expected coverage from sample send outs. This allows you to build a list of engaged media that you can then continue to nurture. Support media who love your stuff by giving them exclusives, sharing brand new product with them first, or just saying thanks.
Press Centre
In your insights tab, you will find:

Your total views. This showcases the number of times your content has been engaged with by media. This includes media who’ve found your images via Flaunter’s library functionality, and the content you’ve sent out to media using our customised links.
Your total search impressions. This shows the number of times your content showed up in a search done by media, brands or influencers.
What does this tell me?
Tracking the number of views and search impressions allows you to:
Track awareness of your brand in the market. As your brand awareness grows, the number of times you’re searched for should also grow. It’s a great sign that what you’re doing from a PR perspective is working.
Demonstrate to clients the amount of awareness you’re generating. Even if not all of these views result in coverage this time, the next time an editor needs something your brand is offering, you might be top of mind.
Top Downloaders shows you which media have engaged with your brand the most.
What does this tell me?
Which editors, influencers and stylists are loving your brand. Knowing who your fans are allows you to support them in return, giving them exclusives, or letting them know when new product is available.
Your imagery mix shows you what the content you’ve uploaded to Flaunter is made up of.

What does this tell me?
Use this data in conjunction with your conversations with editors. Are they seeking more lookbook style imagery or flat lays? Depending on what you’re seeing in the market, you can change up your content mix to better serve your editorial audience.
Top viewed images are the images that are being viewed most often by editors, influencers and stylists - whether this is because they are being shared frequently by you via customised links, or displaying in image searches.

What does this tell me?
This is a great graphic to put into a client report as it gives a visual representation of products media are loving, or that you’re actively pitching.
In your Reports tab, you’ll find:
Your export activity log. This is the number of times your images have been downloaded from Flaunter, either via search or via direct links sent to your contacts.
These can be sorted by downloads, moodboard or images
They can also be filtered by album, date range and media type.

What does this tell me?
What date the journalist is expecting to publish your content. This makes media monitoring infinitely easier, and allows you to report to clients on your expected pipeline of media activity.
Which editors are downloading most of your content, so you can treat them like VIPs.
Downloading your reports via CSV gives you access to a treasure trove of data. You can see the emails of who downloaded your content (which you can then put into your own media list for future outreach), most frequently downloaded content, even the type of downloader who’s accessed your content.
Whew. Did you know Flaunter could give you ALL of that data? Head to your Flaunter account and get busy reporting and making yourself indispensable to your clients.
Want more? Read The Data You’re Probably Missing in Your Business Right Now.
